Tests of Materials
The module compares reflectivity, transmittivity, refraction index, absorption coefficient etc. with those calculated by XOP and other programs.
Find the corresponding scripts in tests/raycing directory.
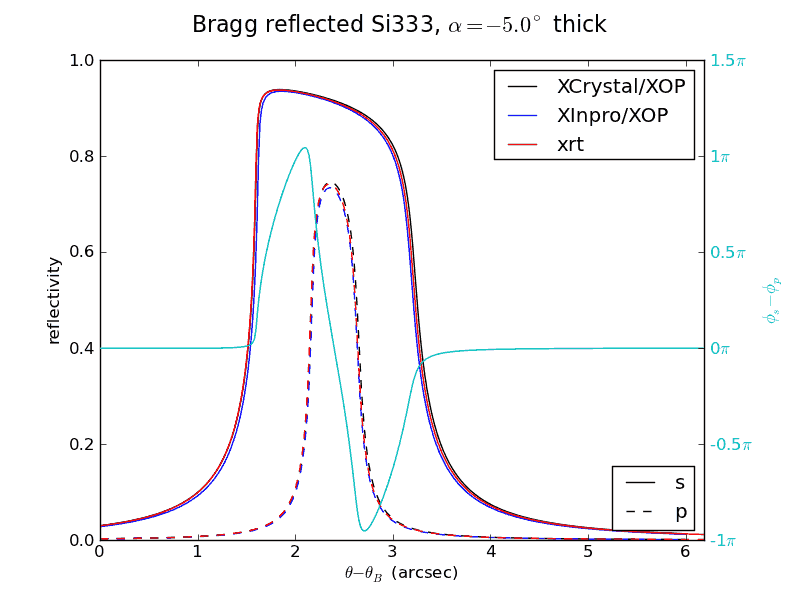
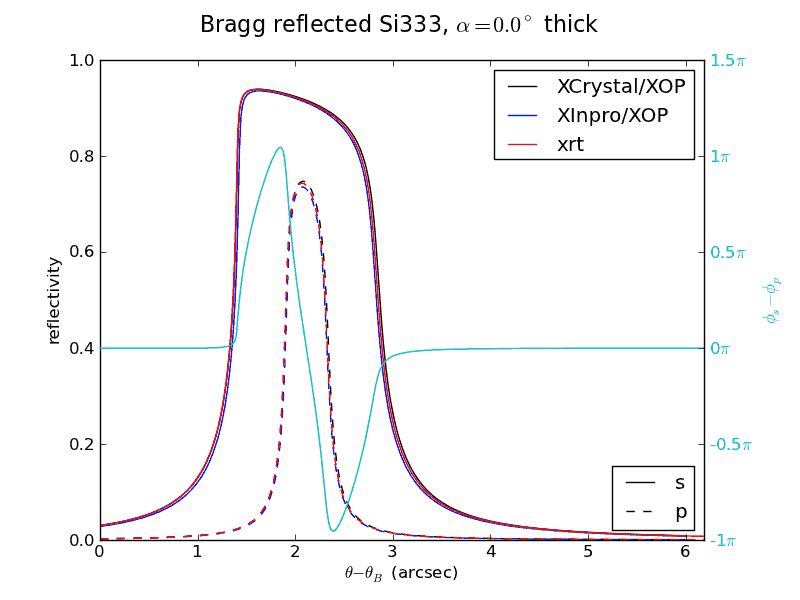
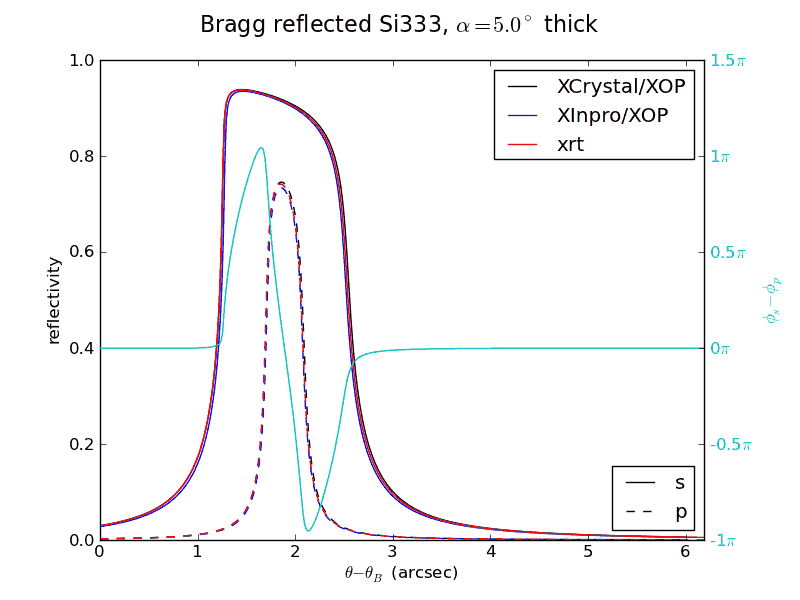
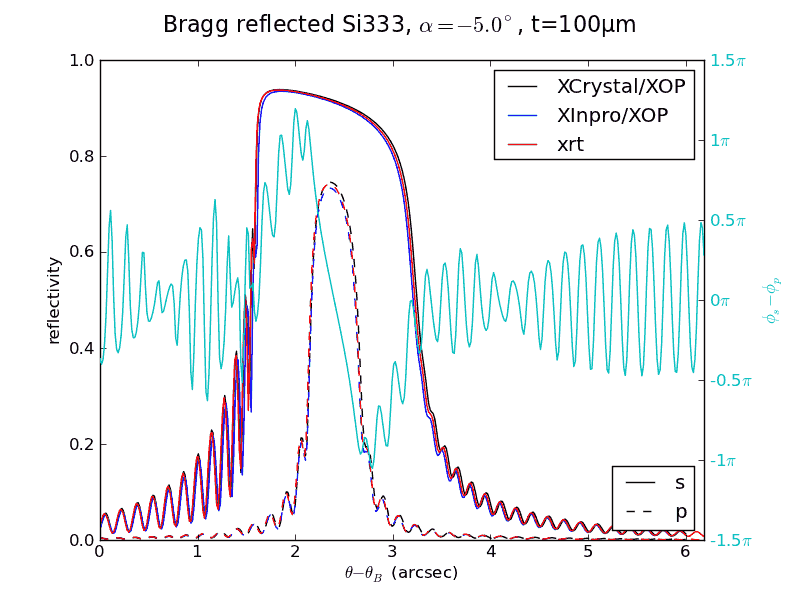
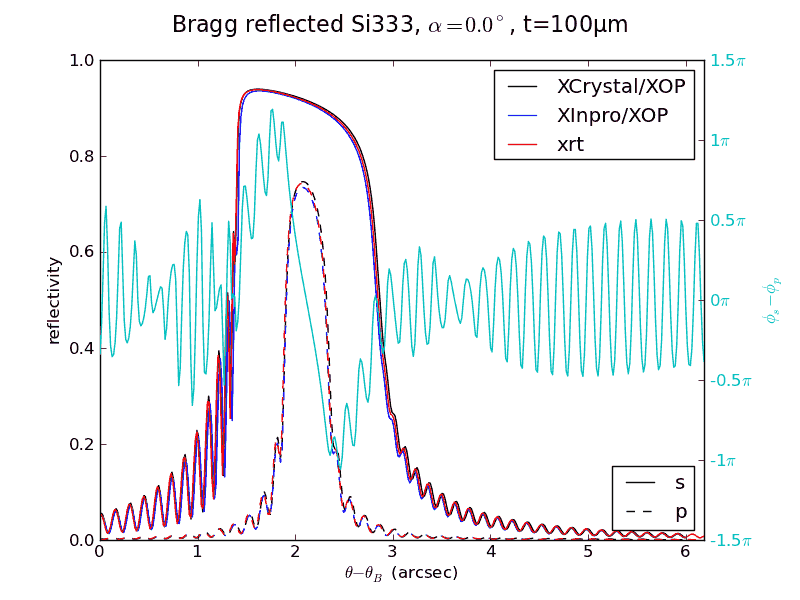
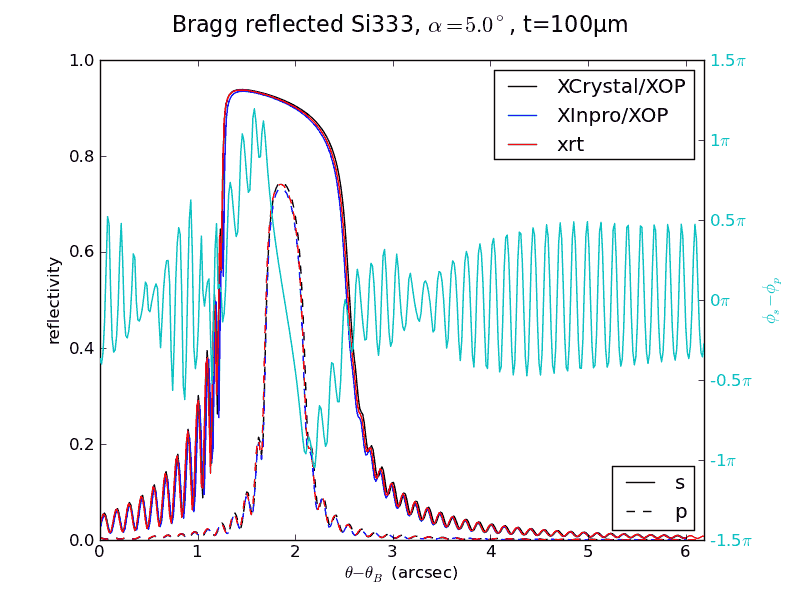
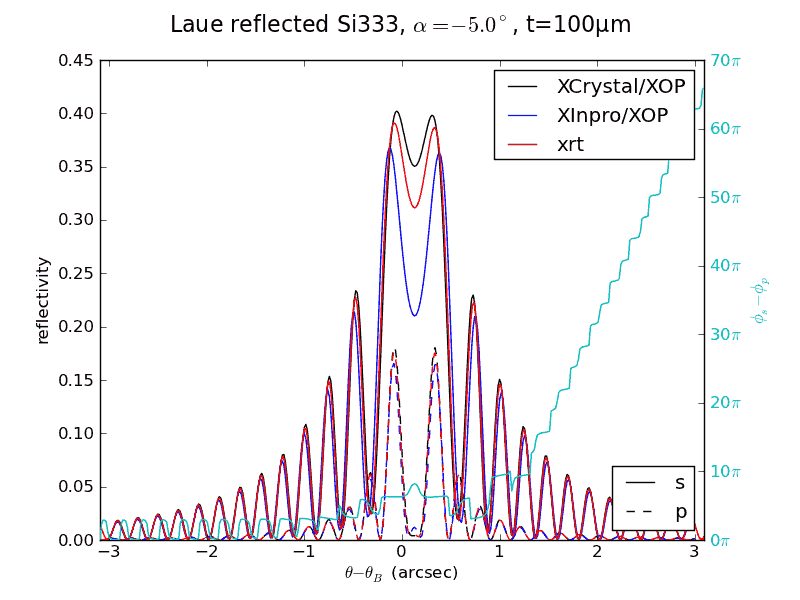
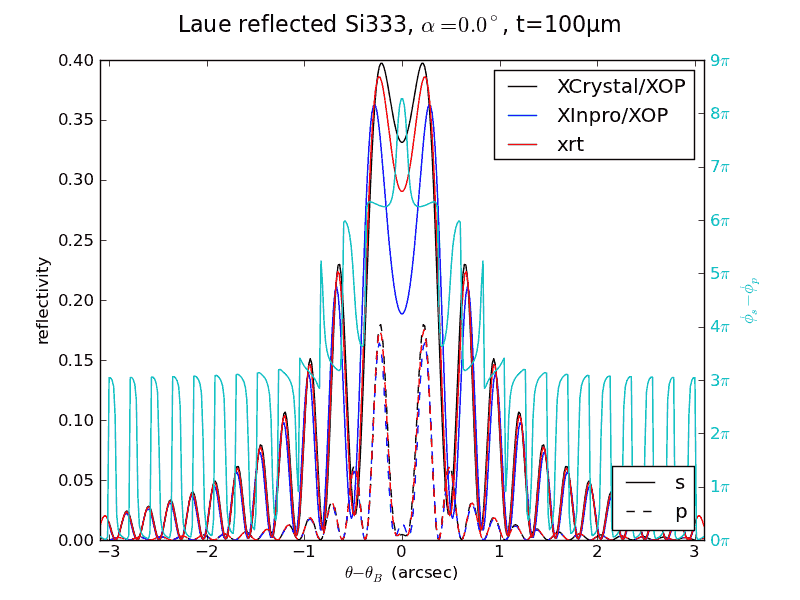
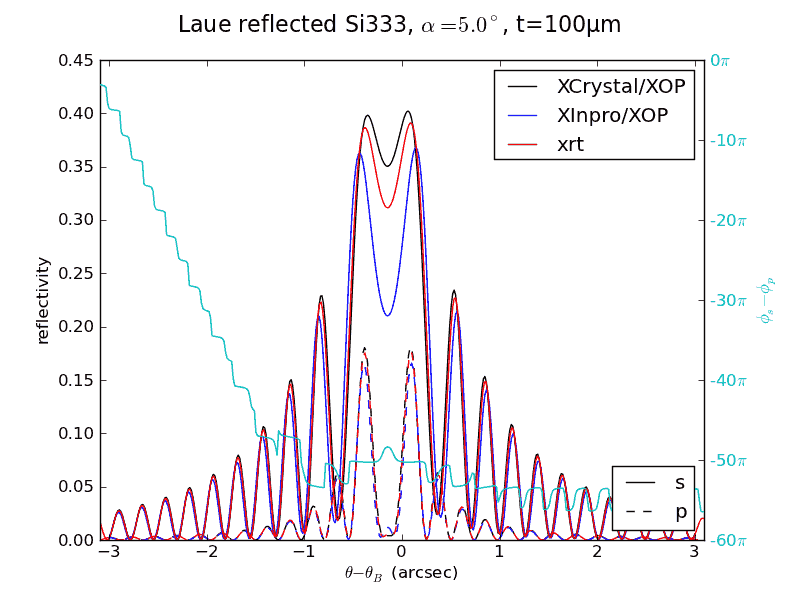
Reflectivity of Bragg and Laue crystals
The small amplitude differences with XOP results are due to slight differences in the tabulated values of the atomic scattering factors.
α = -5° |
symmetric |
α = 5° |
|
|---|---|---|---|
thick |
|
|
|
100 µm |
|
|
|
α = -5° |
symmetric |
α = 5° |
|
|---|---|---|---|
100 µm |
|
|
|
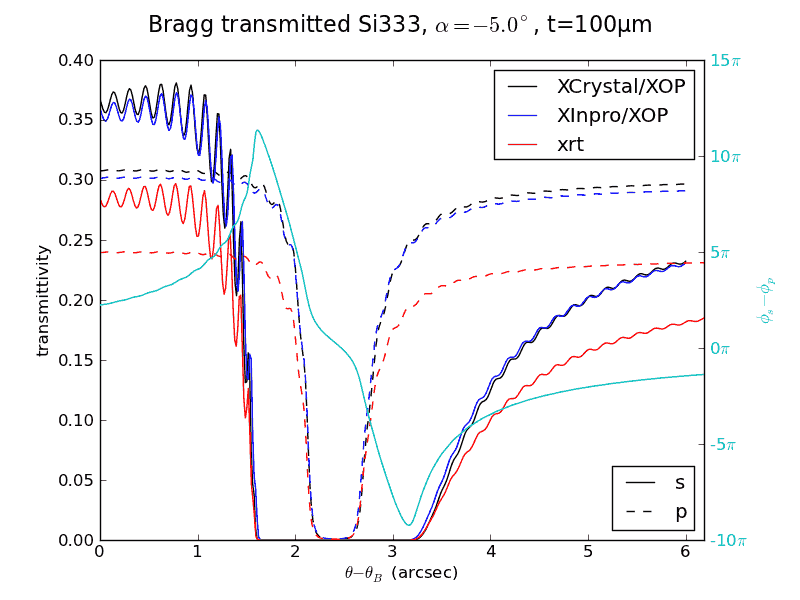
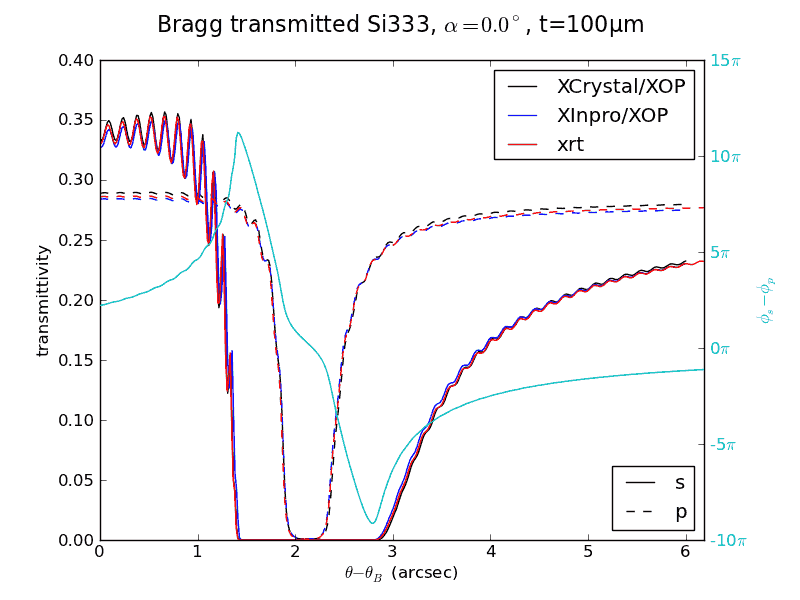
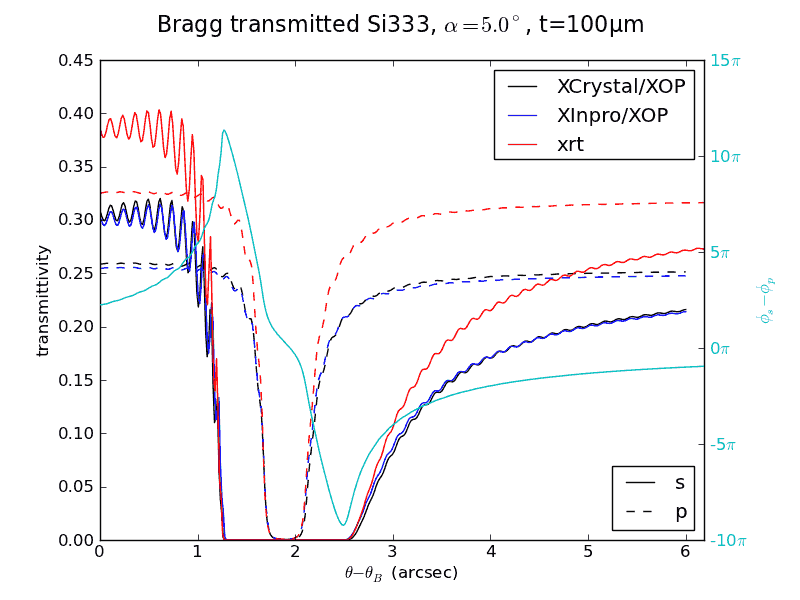
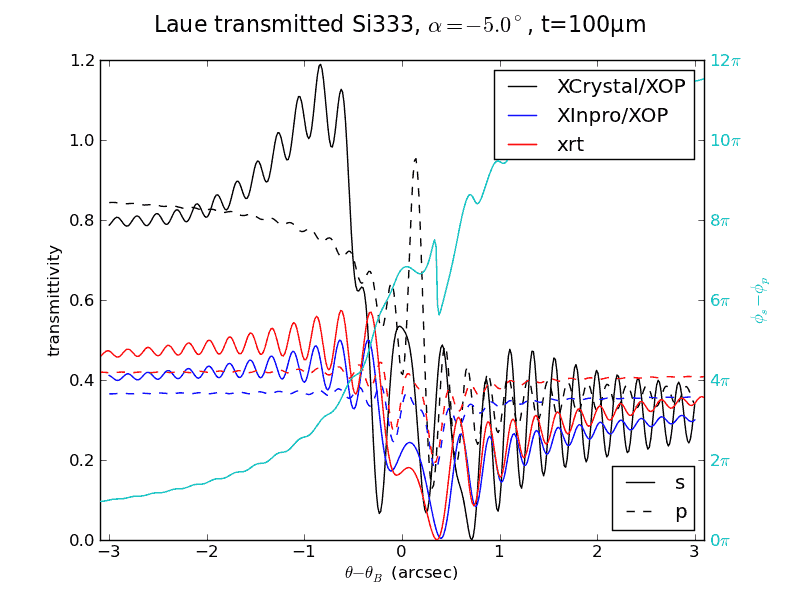
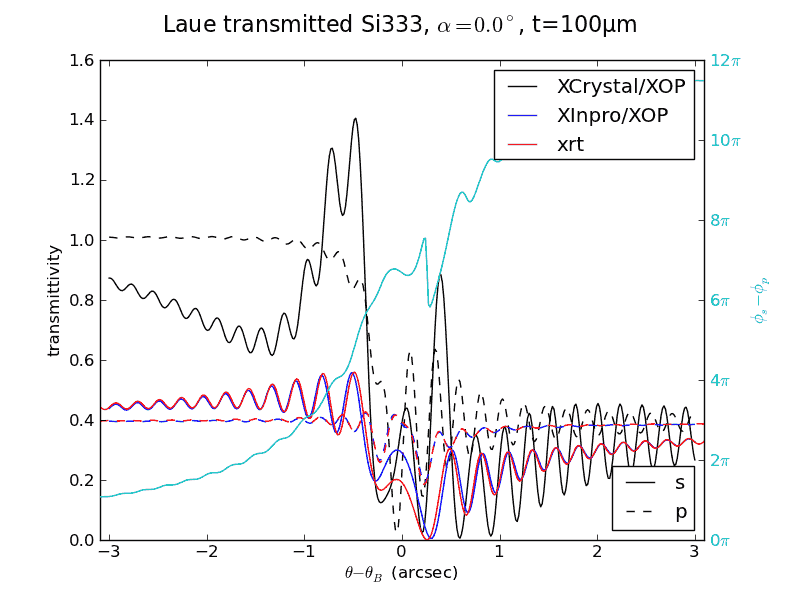
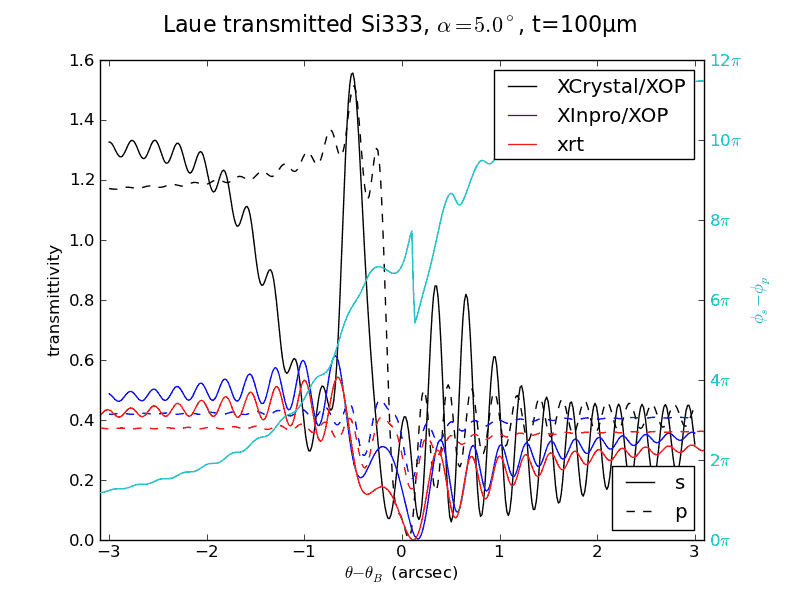
Transmittivity of Bragg and Laue crystals
The curves are basically equal only for the symmetric case. Both XCrystal/XOP and XInpro/XOP are different for asymmetric crystals, when they give too low or too high (>1) transmittivity.
α = -5° |
symmetric |
α = 5° |
|
|---|---|---|---|
100 µm |
|
|
|
α = -5° |
symmetric |
α = 5° |
|
|---|---|---|---|
100 µm |
|
|
|
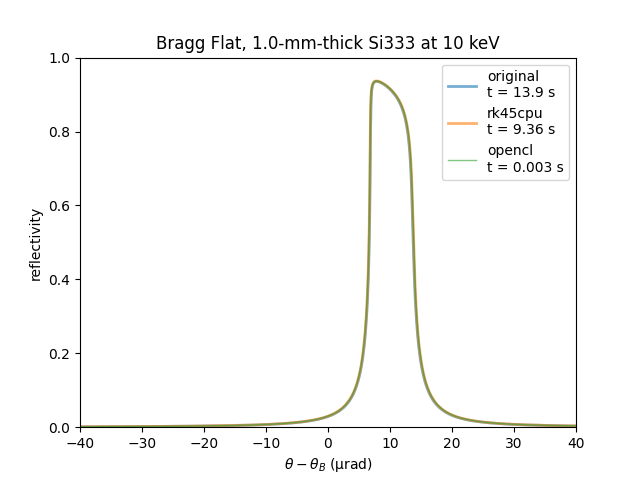
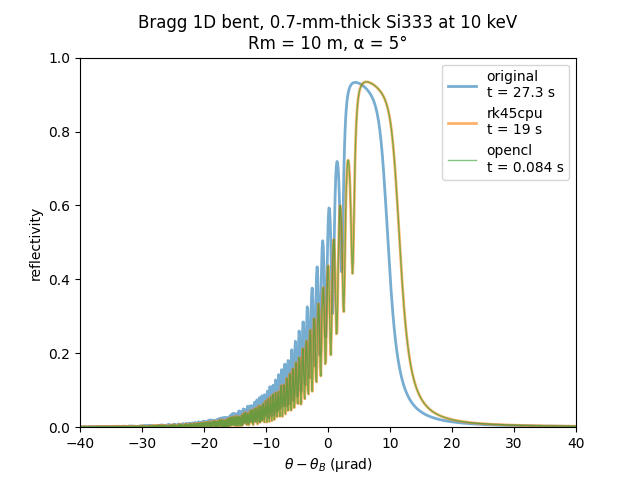
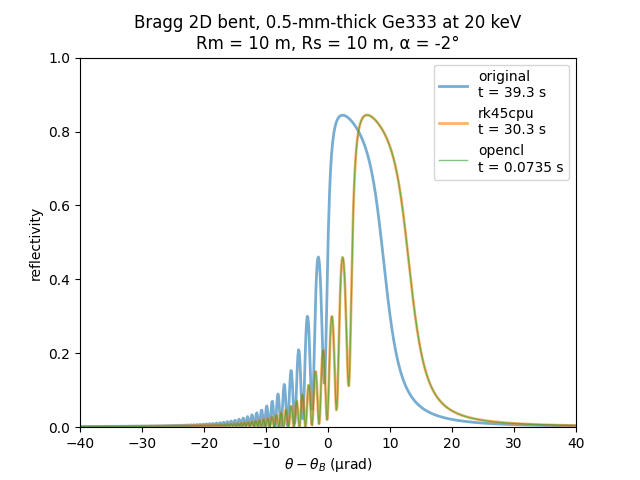
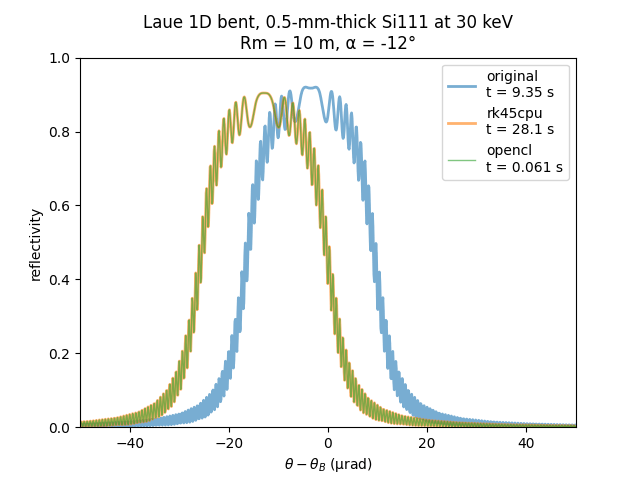
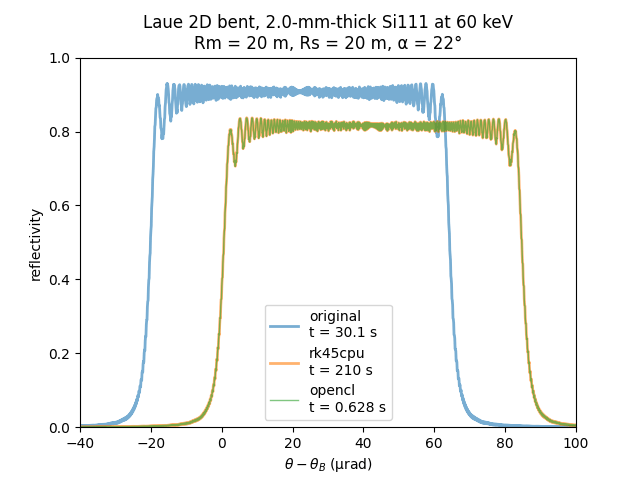
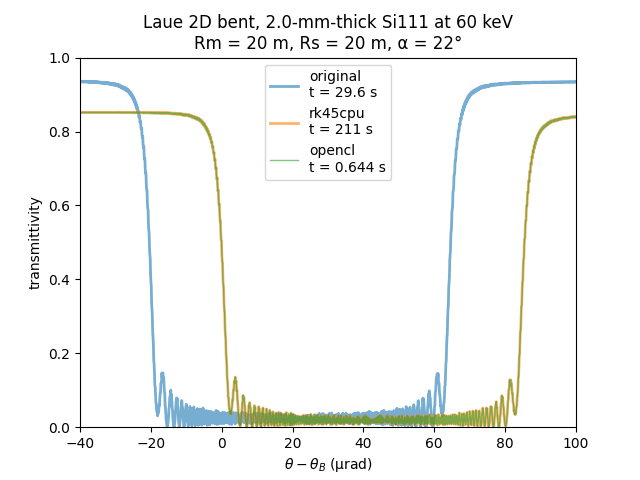
Bent crystals: comparison tests for pyTTE backends
xrt can calculate reflectivity curves of elastically deformed bent crystals. The following three calculation backends are compared below.
1. Original pyTTE. Requires xraylib and multiprocess packages, both are pip-installable. xraylib provides x-ray related material properties. Solution of Takagi-Taupin equations relies on scipy.integrate.ODE, zvode-bdf algorithm. Fails on thick crystals (> 1 mm in case 2), requires increasing ‘nsteps’ in the integrator up to 2-3 million in order to converge. Calculation of transmitted intensity in Bragg geometry is not supported.
2. xrt pyTTE_x CPU. Pure python custom implementation of Dormand-Prince 4/5 adaptive algorithm. Material properties backend can be either ‘xrt’ (default) or ‘xraylib’, selectable via the TTcrystalX mat_backend init parameter. In our implementation, the nominal radius of curvature used for strain calculation is defined at the crystal top surface, while in the original pyTTE, it is centered within the crystal. This difference causes a slight angular shift in the position of the reflectivity peak compared to the original pyTTE implementation. Surface-centered radius of curvature is the standard for the raycing backend of xrt. In this test the position of the radius of curvature can be defined in the TTcrystalX class init by setting the ‘strain_shift’ argument to either ‘xrt’ or ‘pytte’.
3. xrt pyTTE_x OpenCL. Similar to pyTTE_x CPU, ported to execute on GPU with OpenCL. Calculation of transmitted intensity in Bragg geometry is not supported.
Reflectivity of 1D and 2D bent Bragg and Laue crystals
The horizontal shifts are due to different definitions of bending radius. The amplitude mismatch in the Laue cases are due to difference in absorption as calculated by xrt and xraylib.
|
|
|
|
|
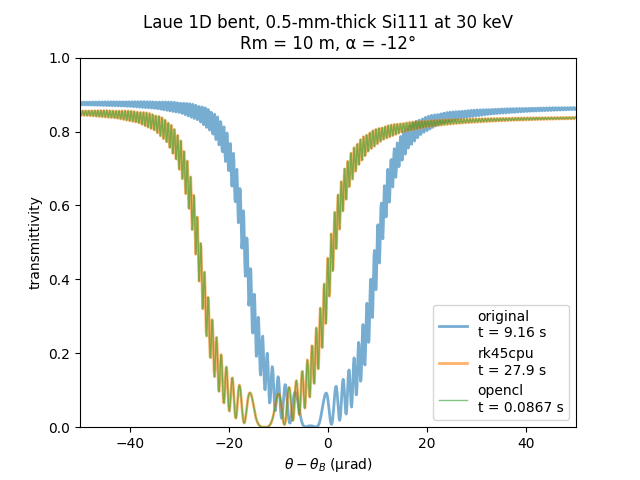
Transmittivity of 1D and 2D bent Laue crystals
|
|
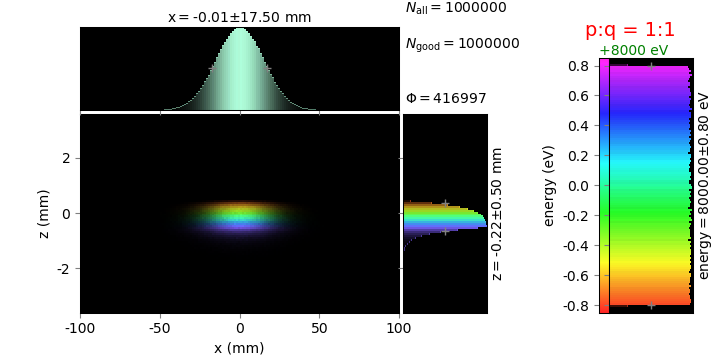
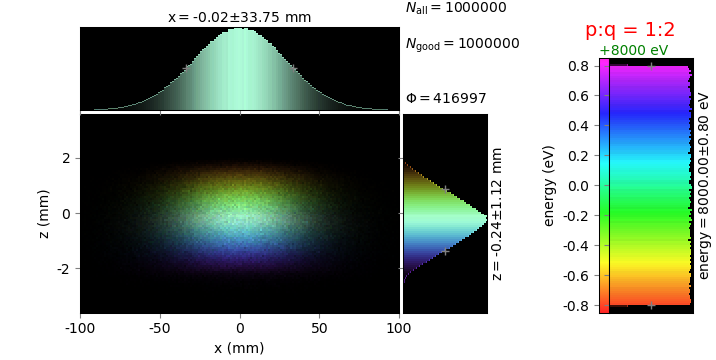
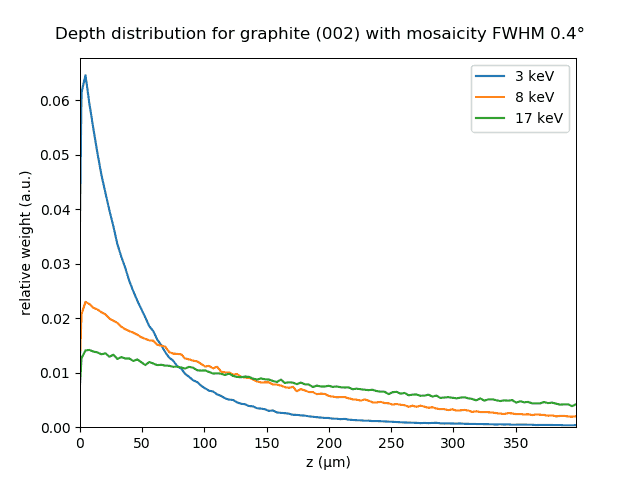
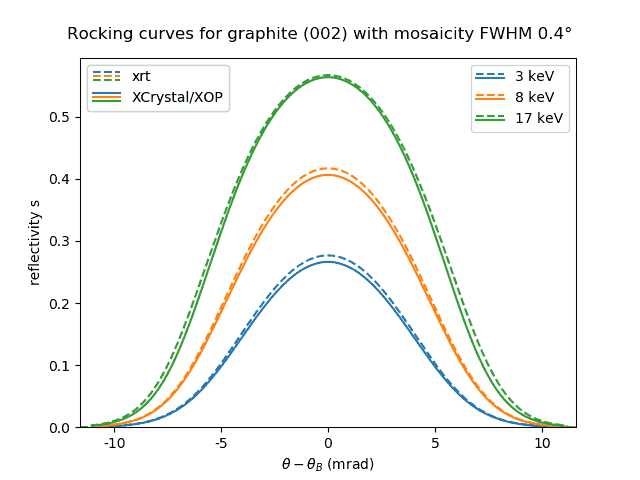
Reflectivity of mosaic crystals
These tests implement the diffraction setup from [SanchezDelRioMosaic], Fig. 4. In our case, the source has a finite energy band to demonstrate the energy dispersion effect in parafocusing (cf. Figs. 5 and 6 ibid).
|
|
The penetration depth distribution should be compared with Fig 7 ibid.
The reflectivity curves are compared with those by XCrystal/XOP [XOP]. The small differences are primarily due to small differences in the tabulations of the scattering factors. We use the one by Chantler [Chantler].
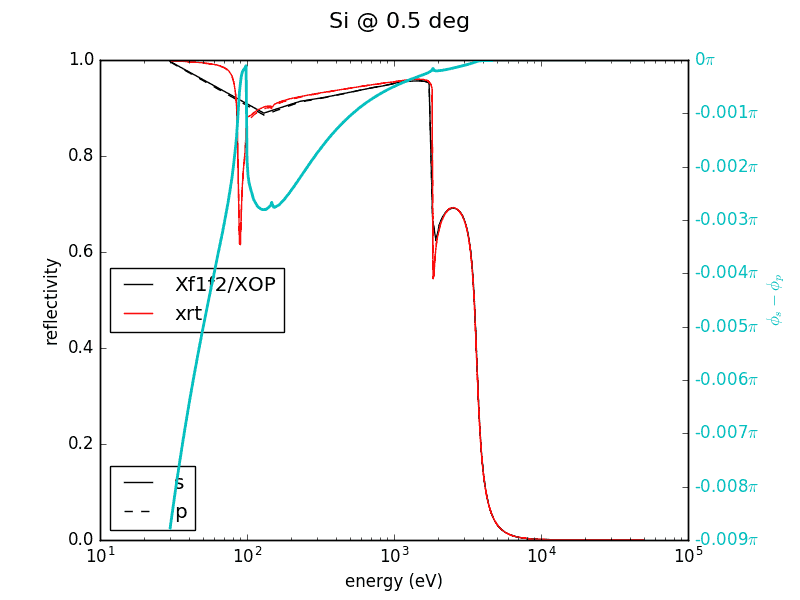
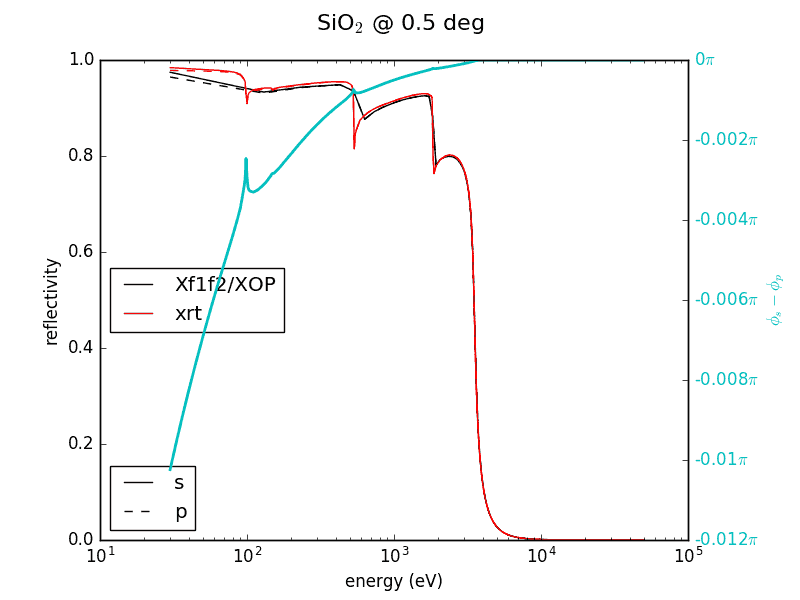
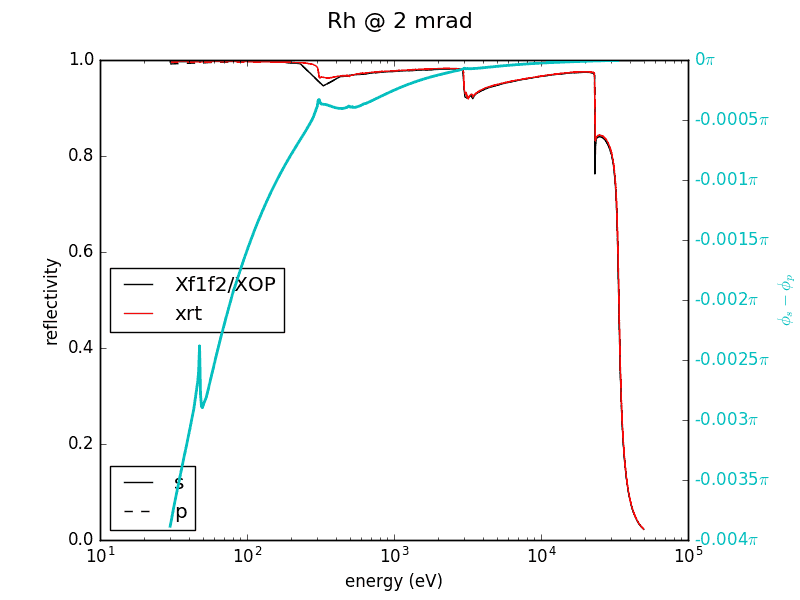
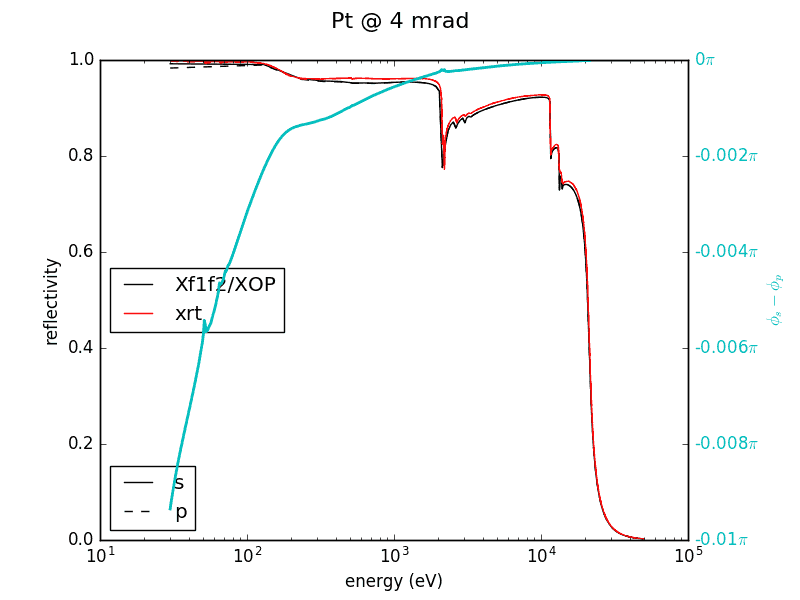
Mirror reflectivity
The small amplitude differences with XOP are due to slight differences in tabulated values of the atomic scattering factors.
|
|
|
|
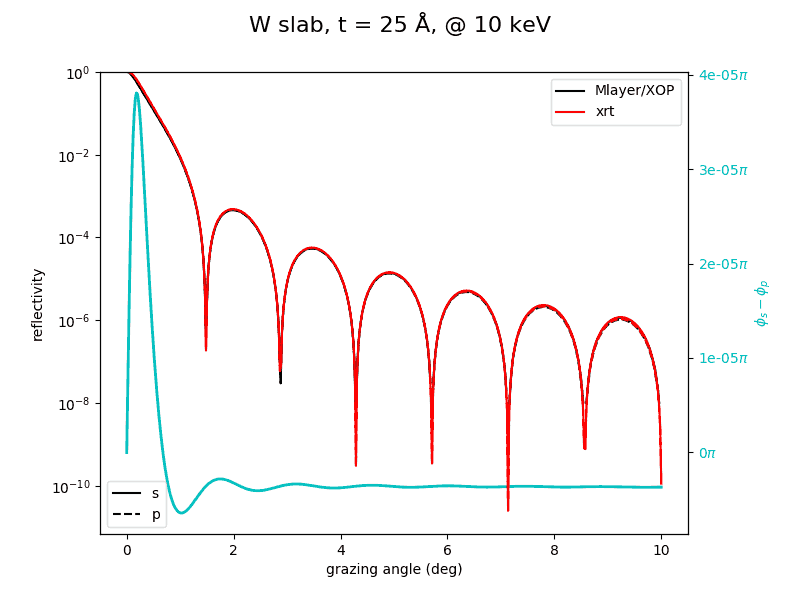
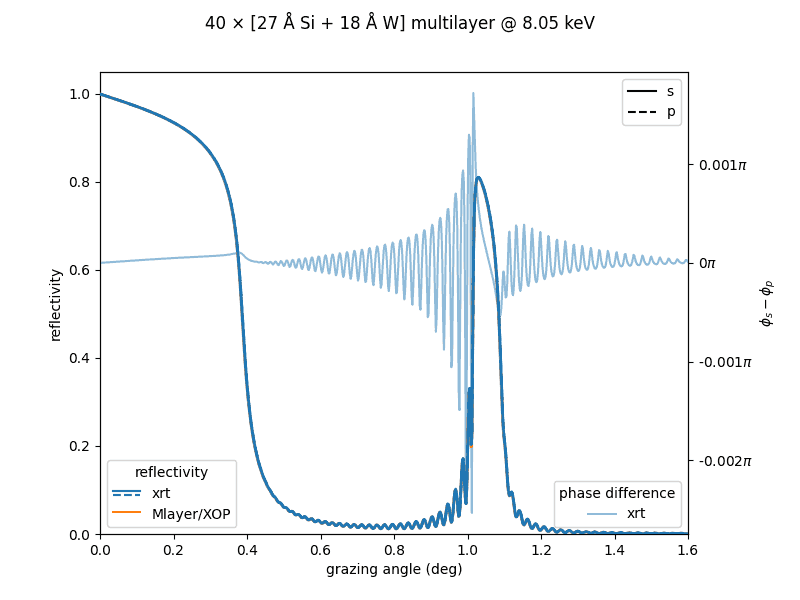
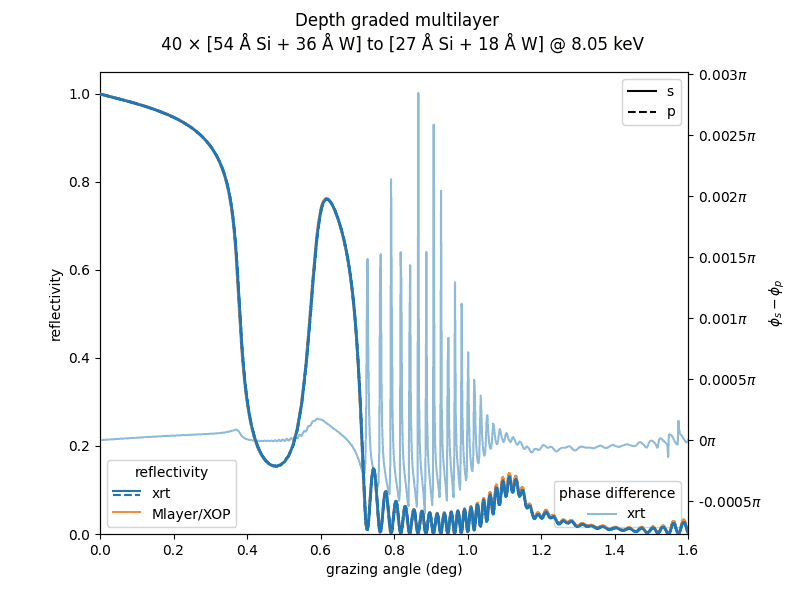
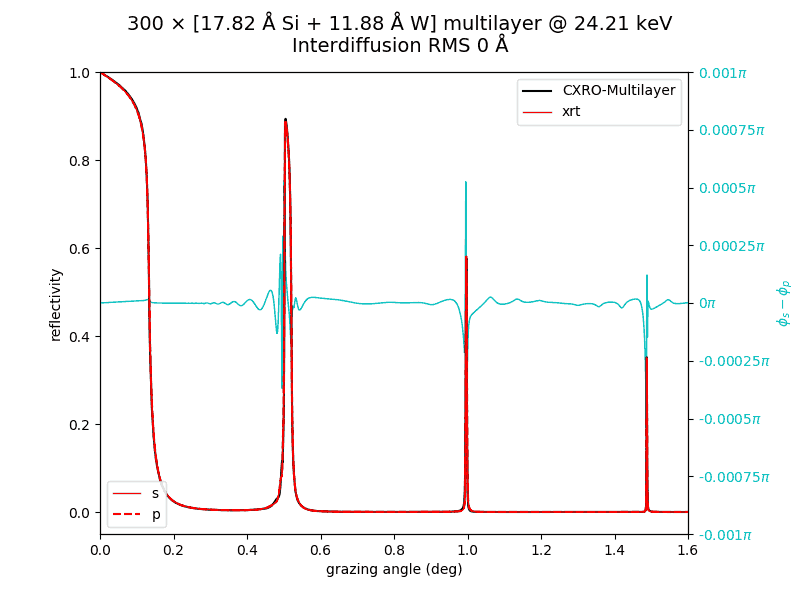
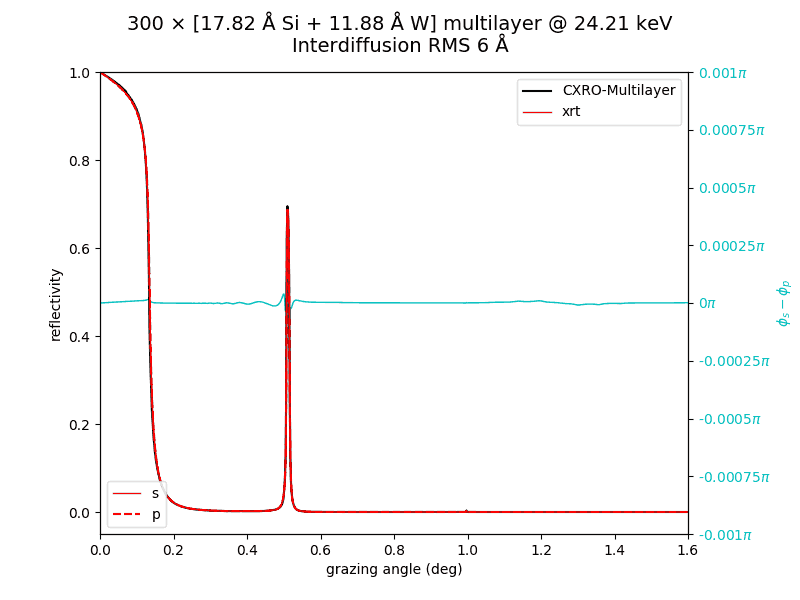
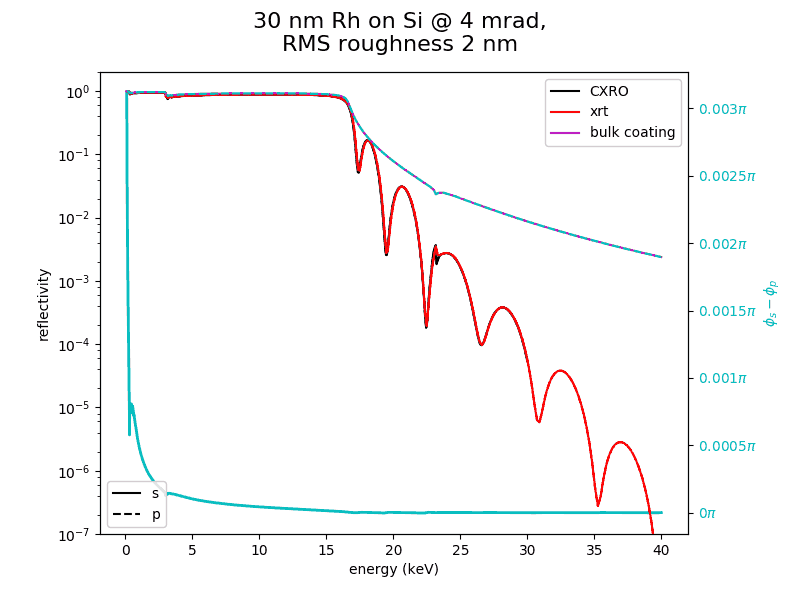
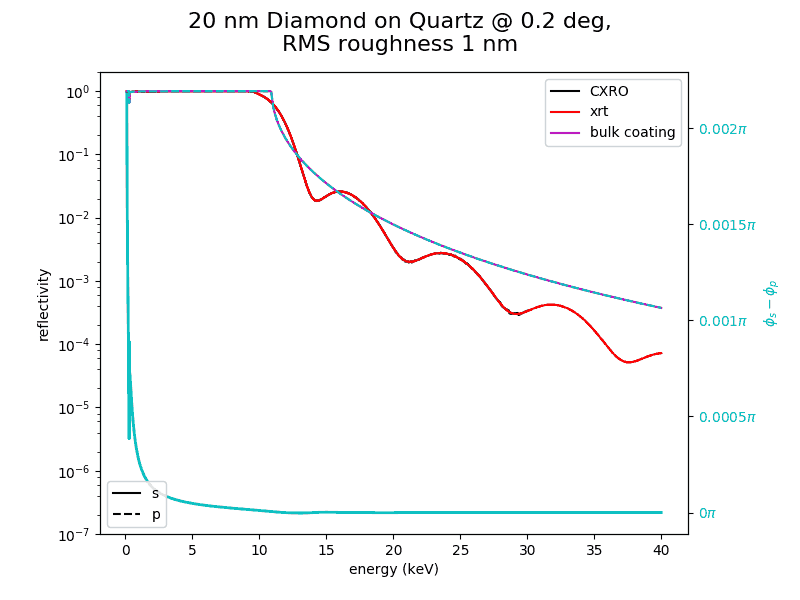
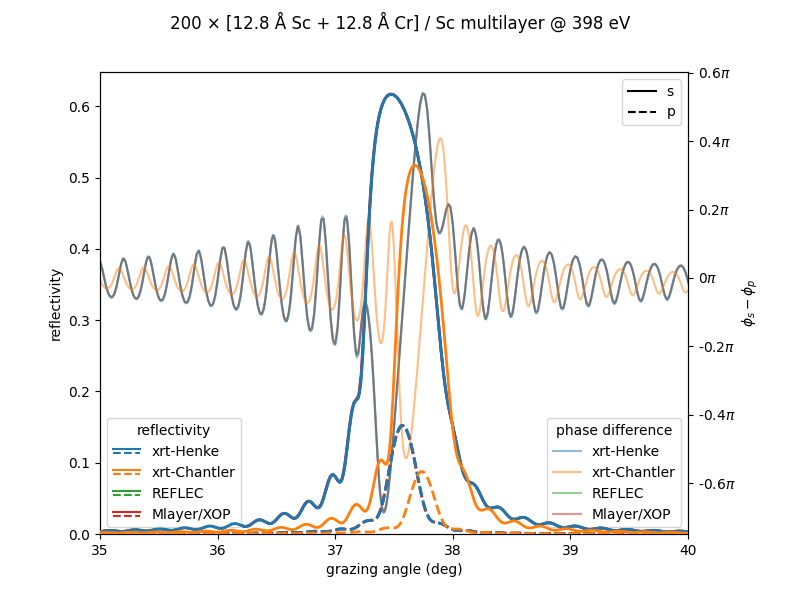
Slab, multilayer and coating reflectivity
Here, the phase difference between s- and p-polarized rays is given without comparison.
|
|
|
|
|
|
|
Note
At low energy, the result strongly depends on the used tabulation. ‘xrt-Henke’ below overplots the curves calculated by Mlayer and REFLEC that use the tabulation by Henke. ‘xrt-Chantler’ is significantly different, and it is more trustworthy.
Note
Mlayer/XOP does not calculate multilayers in transmission.
|
|
Transmittivity of materials
The small amplitude differences with XOP are due to slight differences in tabulated values of the atomic scattering factors.
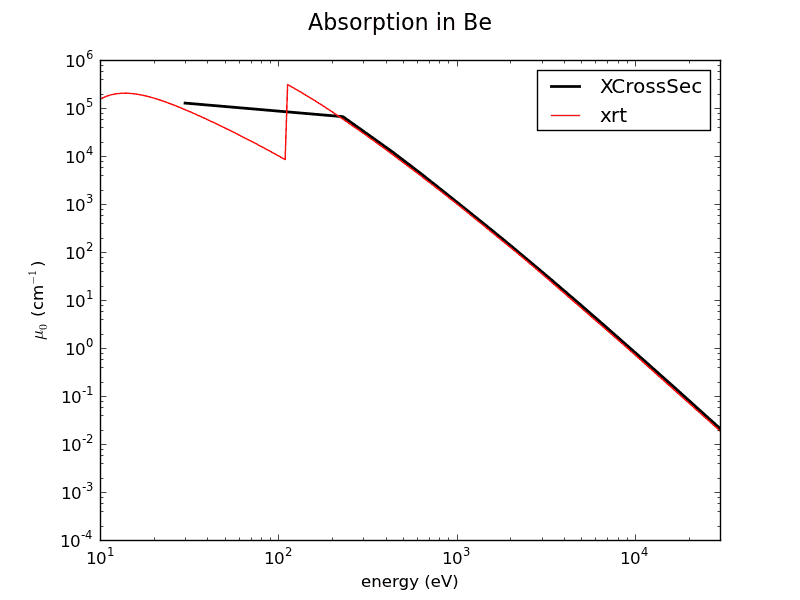
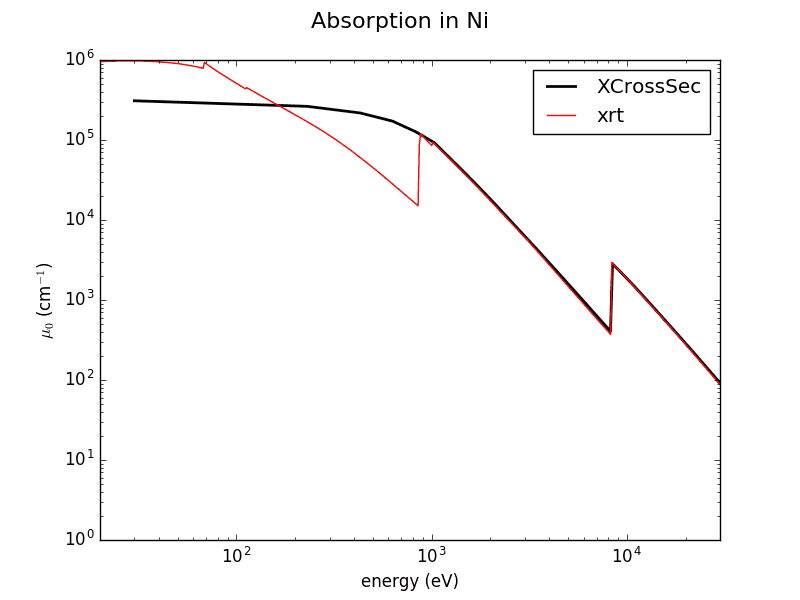
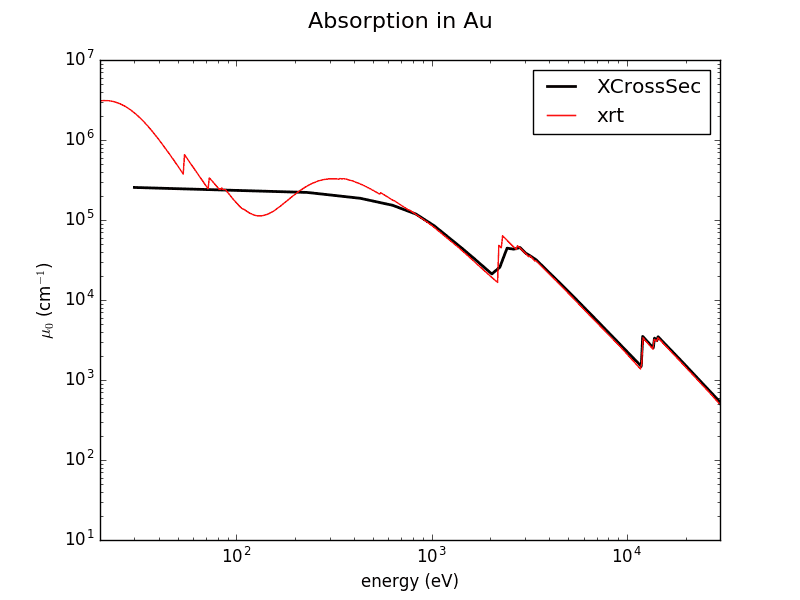
Absorption of materials
The deviations at low energies due to differences in tabulated values of the atomic scattering factors.
|
|
|